
Most enterprise AI privacy discussions still focus on the prompt and the final answer.
That is too narrow.
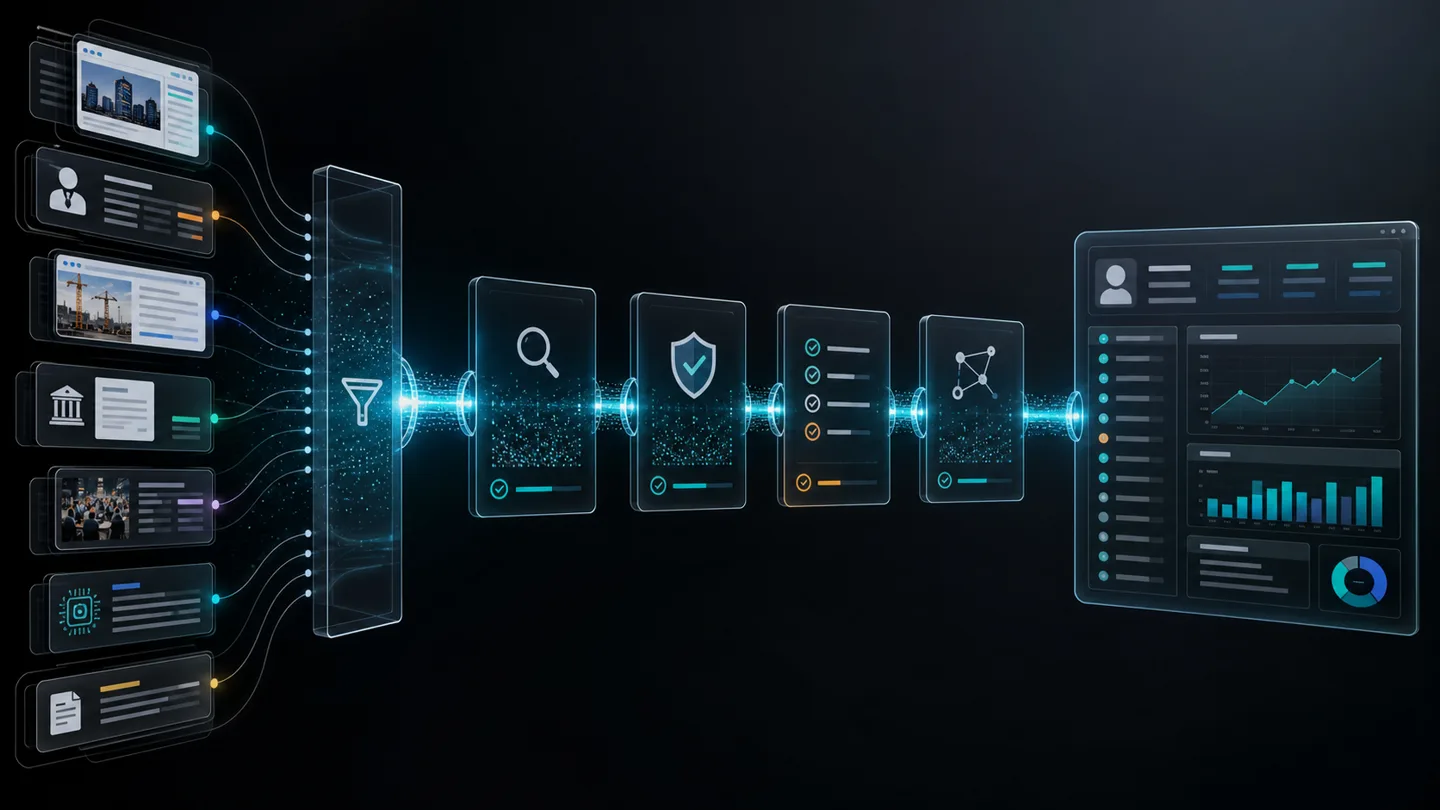
In modern agent stacks, the richer and more useful data surface is often the trace. The trace can include model calls, tool arguments, tool outputs, file references, retrieved snippets, screenshots, approval steps, and correlation metadata across systems. In other words, the debug record may expose more than the customer ever sees in the final response.
That is why enterprise AI needs a trace redaction contract.
A trace redaction contract defines what workflow data is allowed into telemetry, what must be masked or dropped, how long each telemetry class can persist, and who gets to inspect raw traces when something goes wrong.
Why this matters now
Tracing and workflow observability are moving from specialist tooling into default platform behavior.
OpenAI now documents tracing as a built-in Agents SDK capability. Anthropic now documents compliance retrieval for chats, files, projects, and generated artifacts. MCP now documents trace-context propagation conventions. OpenTelemetry keeps standardizing how spans, attributes, and events carry workflow metadata across systems.
That is good news for debugging and evaluation.
It also means enterprise teams can no longer treat telemetry as “just logs.” In AI systems, telemetry is often partial workflow content.
The docs already show that traces are content-bearing surfaces
1. OpenAI traces can capture the workflow, not just a status code
OpenAI’s current integrations and observability guidance says tracing is built into the Agents SDK and enabled by default in the normal server-side SDK path. It says every run can emit a structured record of model calls, tool calls, handoffs, guardrails, and custom spans. The same section says default traces usually include tool calls and their outputs.
That is not lightweight telemetry. That is a workflow record.
If tool outputs include retrieved text, internal identifiers, customer-supplied files, or generated artifacts, the trace may instantly become more sensitive than the short answer shown to a user.
2. OpenAI’s data controls already distinguish multiple storage and retention paths
OpenAI’s current data-controls guidance says abuse monitoring logs may contain customer content such as prompts and responses plus metadata derived from that content. The same page says the Responses API has a 30-day application-state retention period by default, that background mode stores response data to disk for roughly 10 minutes to enable polling, and that data sent to remote MCP servers or other third-party network services is subject to their retention policies.
That matters because one “AI request” can now cross several different storage regimes in a single run.
The prompt may live in one place, the response object in another, the tool call in a third, and a remote service copy somewhere else entirely. A trace redaction contract is how teams keep those boundaries explicit.
3. Anthropic’s retention model changes by feature, not by one universal privacy promise
Anthropic’s current retention guidance says different APIs and features have different storage needs, and that only what is technically necessary for the feature to work is retained. The same page also says Claude Managed Agents is a stateful resource whose session transcripts persist until you delete them.
Anthropic’s feature-eligibility table makes the point even more concrete. The Files API and MCP connector are not zero-data-retention eligible, while other features have different treatment.
So the governance unit is not “the vendor.” The governance unit is the exact feature path used inside the workflow.
4. Anthropic’s Compliance API shows how much rich workflow material enterprises may need to govern
Anthropic’s current compliance content guidance says the compliance endpoints expose chat content, file uploads, projects, and project attachments to compliance reviewers, supporting eDiscovery exports, DLP enforcement, and account-data review.
The same docs say reviewers can fetch the full message content of a chat, including attached files and inline artifacts, and can download file content, generated files, artifact text, and project-document content by ID.
That is useful for governance. It is also a reminder that operational records are not sterile metadata. They can be direct content containers.
5. MCP tool results can contain far more than plain text
The current MCP tools specification says tool results may contain structured or unstructured content. The unstructured content path can include text, image, audio, resource links, and embedded resources. The structured path can contain JSON values that conform to an output schema.
The same specification shows resource links and embedded resources carrying URIs, MIME types, raw text, and annotations.
If those results are copied wholesale into traces, dashboards, or error records, the observability plane can start duplicating sensitive workflow data by accident.
6. MCP and OpenTelemetry standardize cross-system correlation
MCP’s current trace-context propagation conventions document OpenTelemetry trace context in `_meta`, using keys such as traceparent, tracestate, and baggage. The same SEP notes that trace context may include correlation IDs.
OpenTelemetry’s current traces documentation defines spans as the building blocks of traces and says spans include attributes, events, and links. It also says span attributes are key-value metadata and span events are structured log messages or annotations on a span.
That makes traces powerful for distributed debugging. It also means poorly chosen attributes or events can become durable leakage paths for account IDs, filenames, snippets, or internal object references.
What breaks when trace redaction is left implicit
1. Debug systems quietly become secondary content stores
Teams may lock down final outputs while still copying raw tool results, retrieved passages, or file-derived text into traces, dashboards, and alert payloads.
2. Retention policy drifts across workflow surfaces
The visible answer may expire quickly while traces, polling state, attachments, or generated artifacts live longer under different rules.
3. Access control gets weaker in the observability lane
Developers, SREs, or vendors who should only see operational metadata can end up with broad access to sensitive workflow content because the trace is treated like ordinary telemetry.
4. Third-party handoffs become hard to reason about
Once a run touches remote MCP servers, hosted containers, or external observability vendors, teams need to know exactly which content crossed which trust boundary.
5. DLP and review controls miss the most revealing surface
If governance scans only final answers or exported reports, it can miss the richer intermediate records where the sensitive details actually live.
What a trace redaction contract should include
1. A trace surface inventory
Name every telemetry-bearing surface in the route: prompts, model responses, tool arguments, tool outputs, file names, file bodies, retrieved snippets, screenshots, span attributes, span events, correlation IDs, approval steps, and external export payloads.
2. Allowed and forbidden content classes
Decide what may appear in telemetry and what may not. For example, route names and latency metrics may be allowed while raw PDFs, patient identifiers, customer financial data, or full browser screenshots may be forbidden or restricted to break-glass review.
3. Transform rules, not just retention rules
Redaction is not only about deleting later. It is about storing less at creation time. Hash IDs when equality checks are enough. Replace raw document text with citation spans or object references. Truncate tool outputs when only status and schema validity are needed. Keep screenshots or full file content out of default traces unless an explicit review mode is activated.
4. Separate operational telemetry from evidence storage
If a workflow truly needs full raw artifacts for human review, store them in a governed evidence lane with distinct access, retention, and download controls. Do not let the observability stack become the accidental evidence system.
5. Access tiers and break-glass rules
Most operators should see route, timing, error class, and validation state. Far fewer people should be able to inspect raw tool outputs or attached-file derivatives. Define who can cross that line, why, and how the access is recorded.
6. Export and vendor boundaries
State what telemetry can leave the primary execution environment. If traces are exported to third-party SaaS observability, remote MCP services, or shared debugging tools, define the allowed fields and TTL for each destination.
7. A verification pack
Test the real route with seeded sensitive patterns. Confirm they are masked in traces, absent from alerts, absent from dashboards, absent from copied error records, and still available only in the governed evidence path when policy allows.
Questions buyers and operators should ask
- What exact workflow data can enter the trace by default?
- Do tool outputs, file-derived text, or screenshots appear in spans or events?
- Which fields are masked, hashed, truncated, or dropped before export?
- Where do remote MCP servers, hosted tools, or third-party telemetry vendors receive content?
- Who can inspect raw traces, and is that access separately logged?
- How long do traces, response state, attachments, and generated artifacts persist?
- Can the team prove seeded sensitive values are absent from routine telemetry?
- What is the break-glass path when debugging truly requires raw content?
The commercial takeaway
Enterprise AI observability is becoming more capable, more standardized, and more valuable. That is exactly why it needs tighter governance.
Current platform docs already show the direction. Traces can capture tool outputs and workflow steps. Application state can persist separately from the prompt. Compliance interfaces can expose chats, files, projects, and artifacts. MCP can propagate trace context and return rich structured resources. OpenTelemetry spans can carry detailed metadata and events across systems.
So the enterprise question is no longer whether to trace AI workflows.
It is whether the trace is governed as carefully as the answer.
The teams that make that shift early will debug faster without turning observability into a hidden data-leak lane. The teams that do not will discover too late that their most sensitive AI content was never in the final response. It was in the telemetry.
Related reads
- Enterprise AI Needs an Observability Contract: Why Cost, Latency, and Failures Must Follow the Exact Route
- Reasoning Summaries Are Not Audit Logs: The Evidence Standard for Enterprise AI
- Enterprise AI Memory Is a Retention Policy: The Governance Layer for Persistent Assistants
- AI Workflow Services
Sources consulted
- OpenAI docs: Integrations and observability
- OpenAI docs: Data controls in the OpenAI platform
- OpenAI docs: Evaluate agent workflows
- Anthropic docs: API and data retention
- Anthropic docs: Retrieve and delete chats, files, and projects
- Anthropic docs: Files API
- Model Context Protocol docs: Tools specification
- Model Context Protocol SEP-414: OpenTelemetry trace context propagation conventions
- OpenTelemetry docs: Traces