
Teams building production AI now have more telemetry than they had a year ago.
That is good news. It is also a trap.
More telemetry does not automatically mean more truth. It often means more numbers that can be blended across incompatible routes, mislabeled by model alias, detached from fallback behavior, or separated from the workflow state that actually matters to the business.
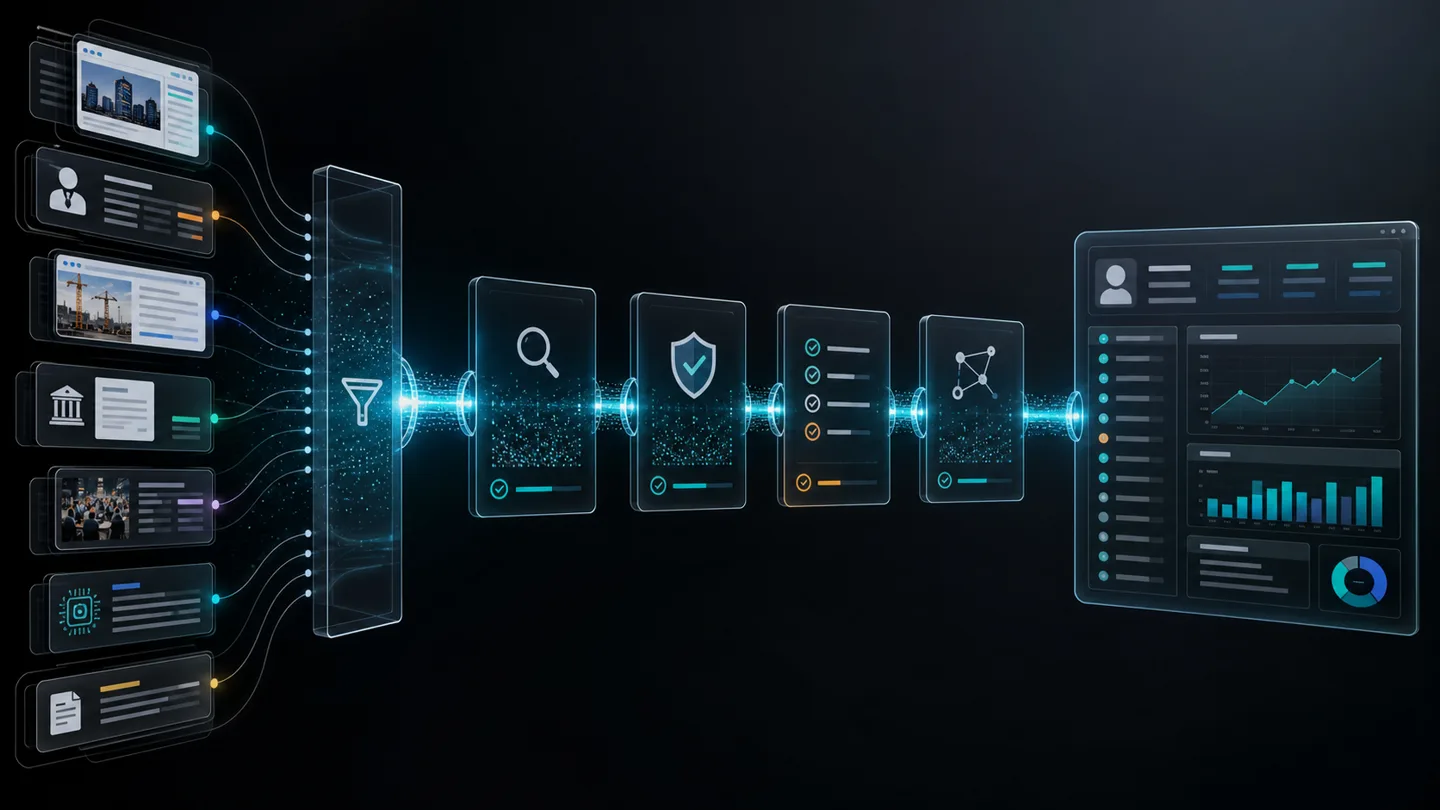
That is why enterprise AI needs an observability contract.
An observability contract defines which signals must exist for a route, how those signals are attributed, how they map to business-critical workflow states, and what evidence must survive when the route changes. The point is not to collect every metric. The point is to make sure the metrics that exist still mean the same thing after model swaps, cache changes, scheduler tweaks, fallback events, or tool-path shifts.
Why this matters now
Current vendor and infrastructure materials make one trend unmistakable: observability is moving from optional debugging detail to normal operating surface.
OpenAI's current official OpenAPI specification includes Admin API endpoints for organization costs and organization completions usage details. Anthropic's current Usage and Cost API says organizations can programmatically access historical API usage and cost data, with detailed breakdowns by model, workspace, service tier, and token categories including uncached input, cached input, cache creation, and output. vLLM's current docs expose server metrics at a /metrics endpoint and can also return per-request timing metrics such as time_to_first_token_ms and queue_time_ms directly in API responses. Hugging Face TGI's current monitoring tutorial says the server exposes multiple metrics for Prometheus and highlights examples such as effective batch sizes, prefill and decode latencies, and the number of generated tokens. OpenTelemetry's current signals documentation says the goal is to collect, process, and export signals and that it currently supports traces, metrics, and logs.
That is a lot of signal surface.
It is also a clear market signal. Serious AI stacks are being instrumented like operating systems, not like toy chat demos.
The missing step is governance. Most teams still monitor AI like a blended service. They ask whether average latency is up, whether spend is on track, or whether error rates crossed a threshold. Those are useful questions, but they are not enough when one visible route can hide many materially different execution lanes underneath.
The docs already show why observability needs its own contract
1. OpenAI exposes organization-level cost and usage as a first-class admin concern
OpenAI's current official OpenAPI specification includes a /organization/costs endpoint summarized as "Get costs details for the organization" and a /organization/usage/completions endpoint summarized as "Get completions usage details for the organization".
That matters because it moves AI telemetry up a level. Usage and cost are no longer just per-response artifacts. They are organization-level operating signals.
But those signals still need attribution discipline. A cost chart that does not distinguish primary route, fallback route, tool-enabled path, or cache-heavy path can hide the real operational story. Total spend may look flat while one high-consequence lane becomes dramatically slower or more failure-prone.
2. Anthropic makes token economics and organizational breakdowns directly queryable
Anthropic's current Usage and Cost API describes programmatic and granular access to historical API usage and cost data for an organization. Its usage endpoint is described as tracking token consumption with detailed breakdowns by model, workspace, and service tier. The same page also highlights token categories that separate uncached input, cached input, cache creation, and output.
That is more than finance reporting.
It means observability now reaches into workflow design decisions. Cache policy, workspace segmentation, and route selection all become measurable economic choices. If those choices are not named in the route contract, later dashboards can show the costs without explaining the cause.
A useful observability contract preserves that context. It records which workflow lane was allowed to use cached context, which lane could reach premium service tiers, and which lane was expected to trade latency for cost.
3. vLLM distinguishes server-wide health metrics from per-request metrics
vLLM's current Production Metrics page says the system exposes metrics via the /metrics endpoint on the OpenAI-compatible API server. Its Per-Request Metrics page then adds a second level of observability by returning request-level timing data directly in API responses, including time_to_first_token_ms, generation_time_ms, queue_time_ms, mean_itl_ms, and tokens_per_second.
The same page also warns that enabling per-request metrics at high concurrency may introduce non-negligible CPU overhead and should be benchmarked before production use.
That pair of documents exposes a practical truth many teams miss. AI observability has architecture tradeoffs. The richer the telemetry, the more carefully teams need to decide where it is sampled, which lanes always carry it, and which lanes only enable it during investigations or release tests.
That tradeoff belongs in a contract, not just in an engineer's memory.
4. TGI shows model-serving metrics are already product signals
Hugging Face's current TGI monitoring tutorial says TGI exposes multiple metrics that can be collected by Prometheus. The examples it highlights include effective batch sizes, prefill and decode latencies, and the number of generated tokens.
Those are not generic infrastructure metrics. They are route-shaping metrics.
If batch sizes improve while queue time worsens, if generated tokens rise while useful completions fall, or if decode latency stays stable while prefill grows because context changed, the business needs to know which route contract changed. Otherwise operators only see symptoms.
5. OpenTelemetry formalizes that one signal stream is not enough
OpenTelemetry's current signals documentation says the purpose of OpenTelemetry is to collect, process, and export signals and describes signals as system outputs that support observation from different angles. It explicitly lists traces, metrics, and logs.
That framing fits enterprise AI exactly.
Metrics tell you that queue time climbed. Traces tell you which step stalled. Logs tell you what the route decided and why. In consequential AI workflows, you usually need all three. Cost alone does not explain failure. Latency alone does not prove route drift. Error count alone does not explain whether the lane retried, fell back, or stopped cleanly.
What breaks when observability stays implicit
1. Model aliases hide route changes
If the dashboard groups everything under one friendly model name, teams can miss a shift in revision, quantization, cache behavior, scheduler policy, or fallback lane. The metric trend stays continuous while the underlying route changed.
2. Blended latency conceals queue pain
Time to first token, scheduler wait, prefill cost, and decode duration do not mean the same thing. A single p95 latency number can hide whether the route is compute-bound, queue-bound, or overloaded by long context.
3. Spend looks acceptable while the wrong lane is burning budget
Organization-wide or workspace-wide costs are useful. But without route labels, a cheap bulk lane can mask expensive retries or oversized prompts in a high-value lane that actually needs operator attention.
4. Fallback success hides primary-route failure
If a workflow quietly shifts to a backup model or degraded path, top-level success rate may remain strong while the intended route is unhealthy. That is not resilience if nobody can see it.
5. Incident review loses the evidence packet
When a route misbehaves, teams need more than charts. They need the route identity, request class, cost profile, queue state, tool state, and outcome state that explain what actually happened.
What an enterprise AI observability contract should include
A useful observability contract does not have to be complicated. It has to preserve the few decisions that make the numbers meaningful.
1. Route identity
Record the exact route that ran: model or provider, revision when applicable, fallback eligibility, cache mode, scheduler or batching policy, tool mode, and approval state. If those change, the route identity changed.
2. Request class
Separate interactive chat, batch review, retrieval-heavy analysis, browser-agent work, and side-effecting workflows. Different request classes should not share one undifferentiated success or latency metric.
3. Latency decomposition
Track at least queue time, time to first token, generation time, and end-to-end completion. That makes it easier to tell whether the route is waiting, thinking, decoding, or blocked by upstream policy.
4. Cost and token semantics
Distinguish cached and uncached input, output tokens, and any route-specific cost drivers such as premium tiers or long-context paths. Do not treat spend as one bucket if the workflow uses multiple economic modes.
5. Failure and stop taxonomy
Define the classes that matter: overload, rate limit, timeout, policy refusal, schema failure, fallback success, reviewed stop, ambiguous outcome, or dead-letter diversion. A single "error" counter is not enough.
6. Trace and log correlation
Tie metrics to run IDs, approval receipts, evidence packet IDs, or workflow trace IDs so incident review can move from chart to exact event path without guesswork.
7. Sampling and overhead rules
Some telemetry is expensive. vLLM's current docs explicitly warn that per-request metrics can add CPU overhead at high concurrency. The contract should say which lanes always collect request-level metrics, which lanes sample them, and which lanes only enable them during release validation or incident response.
8. User-visible state mapping
Be explicit about what an operator or downstream system sees when a route slows, falls back, retries, or stops. Observable internal state should map cleanly to visible workflow state.
Questions buyers and operators should ask
- Can you identify the exact AI route that produced this output, including fallback or degraded mode?
- Do your metrics separate queue time, time to first token, generation time, and full workflow time?
- Can cost data be broken down by route, workspace, cache class, and request type?
- If a backup model runs, does the dashboard show that explicitly or bury it inside success rate?
- What evidence survives an incident besides screenshots of a chart?
- Which telemetry is always on, which is sampled, and which is too expensive for steady-state production?
- Can you correlate one customer-visible outcome to metrics, traces, logs, and approval state without manual reconstruction?
- If the model name stays the same but cache, scheduler, or tool path changes, does observability preserve that route change?
If those answers are vague, the dashboard may still be useful for demos. It is not yet reliable enough for operational accountability.
The commercial takeaway
AI observability is getting better fast.
Current OpenAI, Anthropic, vLLM, TGI, and OpenTelemetry materials all show that usage, cost, latency, batch behavior, and traces are becoming normal operating surfaces. The advantage will not come from having more charts than everyone else. It will come from making the charts explain the exact lane that ran.
That means defining route identity, telemetry scope, failure classes, and trace correlation before production complexity makes those distinctions impossible to recover after the fact.
The teams that do this well will not just know that an AI route got slower or more expensive. They will know which route changed, why it changed, what business state it affected, and what safer action comes next.
That is what turns observability into governance instead of decoration.
Related reads
- Private AI Needs SLOs: Why Local Inference Is an Operations System
- Model Names Are Not Release IDs: Why Private AI Needs a Revision Contract
- Enterprise AI Needs a Failure-Class Contract: Why Not Every Retry Means the Same Thing
- AI Agents Need Circuit Breakers: Why Retries Without Trip Conditions Create Runaway Automation